What survived — and what it is worth
Welcome back, one last time. This is the final episode of AlphaFrame, and we want to open it with a plain statement of what today is, and what it is not.
Seven episodes ago we started with a promise: no hero stories, just method. Since then we have built engines — momentum, regime filters, and deep learning, meaning LSTM networks with attention over ETFs — and we have marched every one of them through the same gate: a split into training, test, and validation, where a model earns its place only on data it never saw. Most of them died there. That graveyard is not the failure of the series; it is the series. Every kill was the method doing its job.
Today we show what is left standing. Three things, concretely. First, the survivors: which engines cleared the gate, and what job each one is actually for. Second, an honest price tag: what the whole toolkit is worth in net, aggregate terms — with one warning we will repeat every time a number appears: the figures for our main research models are in-sample, measured on the same history those models were fit on. Descriptions, not promises. Third, the part we care about most: two dated verdicts. We have pre-registered our own judgment — the rules and the dates were written down before knowing the outcome. Two candidate models face their decision in December 2026. The European ensemble gets its verdict on 30 June 2027. Until those dates, the honest expected value of the new work is: unknown.
So, no victory lap. A survivor on a gate is a candidate for the future, not a guarantee of it. If this series has one thesis, today is where we land it: the method is the product, and the verdicts are dated. Let us start with a recap of the engines.
The engines at a glance
Before we hand out verdicts, one last look at the map you now know by heart: the engine room. An engine, in this series, is simply a rule set that turns market data into a portfolio — nothing more mystical than that.
Family one: the research trio, three portfolios run by deep learning — LSTM networks with attention over ETFs, recurrent models that read return histories and learn what to overweight. Model 3 works US sector funds plus gold and long Treasuries; its character is balanced, all-weather. Global adds Europe and emerging markets to US sectors, with broad bonds and gold; it is the aggressive, high-beta one. Permanent holds broad US equity, gold, long Treasuries and short-term cash; defensive, deliberately decorrelated from the market. One caution we will repeat all episode: the trio's long track records are in-sample — the models were fit on that same history — so every number you will see from them describes the past; it does not promise the future.
Family two: the candidates — two newer multi-seed DL ensembles on the global universe, one reading a macro curve, one deliberately blind to it. They were built to be judged out-of-sample, and their verdict is pre-registered — date and criteria fixed in advance — for December 2026. Alongside them sits the European ensemble, whose own dated verdict arrives on 30 June 2027. More on both later.
Family three: the mechanical rules, no learning at all. Cross-sectional momentum ranks ETF clusters — equity, bonds, commodities — by recent performance and holds the leaders. The Investment Clock reads growth and inflation and maps each macro season to a fixed allocation. The bond sleeve applies simple momentum to US bond funds — Treasuries, credit, emerging-market and mortgage debt — and holds the top three.
Today, each of these gets two things: a verdict — what the evidence honestly supports — and a job, the role it earns, if any. We start with the survivors.
The survivors list
Here is the survivors list itself — the engines from our recap, now with their paperwork: for each one, a status, a job, and the evidence behind it. Read the status column carefully, because nothing in it is an adjective.
Three engines are among the main models. Model3 runs live with weekly rebalancing — the all-weather generalist, our LSTM networks with attention over ETFs, allocating across a broad multi-asset universe. Global runs live as the aggressive engine: higher beta, equity-heavy, built to earn more when markets rise and to pay for it in drawdowns. Permanent runs live as the defensive anchor; its correlation to the S&P 500 is 0.54 — roughly half — which is exactly the job it was hired to do: diversify, not chase. One caution we will repeat throughout this episode: the track records behind these three are in-sample. The models were fit on that same history, so those numbers are evidence of design, not proof of future edge.
Then the candidates. Cand-OFF and cand-ON sit in registered testing, which means the promotion rule was written down before the results: they graduate only on clean out-of-sample dominance — outperformance on data the models never saw — and the decision date is fixed: December 2026. Not sooner, and not on the strength of a good month.
Three more lines. The Investment Clock regime rule passed three out of three pre-registered gates against a 60/40 benchmark — the standard sixty-forty stock-bond mix — with one honest caveat: its weights carry an in-sample fingerprint. The mechanical bond sleeve, a simple rules-based bond allocation, is deployable — and we note with some humility that it beat our own deep learning at that job. And the European sector-plus-bond ensemble is frozen in registered testing — no further tweaks allowed — verdict 30 June 2027.
Every survivor has a dated status, not an adjective. Next: the headline track, numbers included, caveats attached.
The headline track
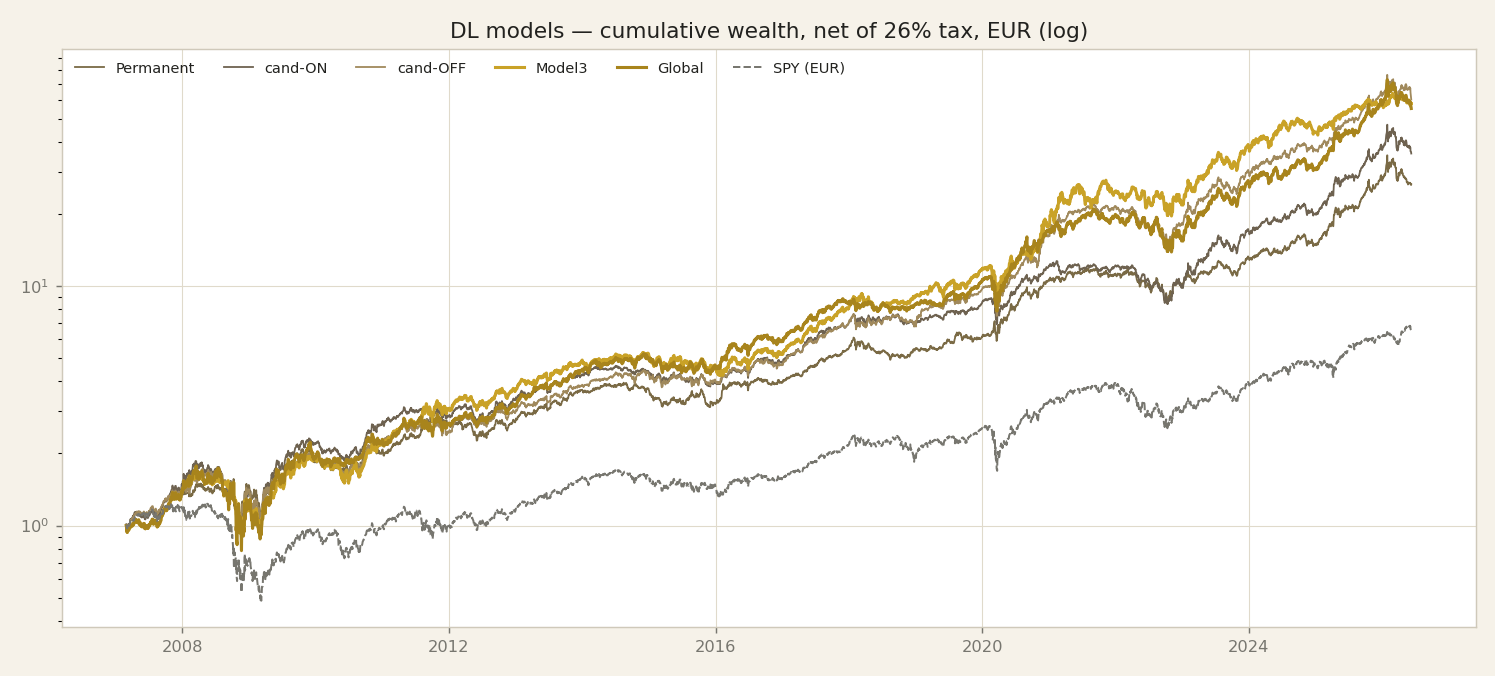
Here is the chart everyone waits for, and it is also the one that needs the most careful handling. What you see is the cumulative net track of the research trio — the three survivors from the last slide — over roughly nineteen years, in euros, net of the 26 percent tax we apply to every gain. Net means after tax: nothing on this slide is a gross, best-case figure. The benchmark line is SPY, the S&P 500 fund, treated exactly the same way.
The numbers first. Model3 — our LSTM networks with attention over ETFs — compounds at roughly 23.5 percent a year. Global, the momentum engine, at roughly 23.2. Permanent, the defensive allocation, at roughly 18.6. SPY lands at roughly 10.8 percent net. CAGR — compound annual growth rate — simply means the steady yearly rate that carries you from the start of the track to the end.
Now the part we say loudly, because this is the finale and it is the thesis of the whole series: these numbers are in-sample. In-sample means the models were fit on this very history. The chart is the map of what they did on the ground where they learned; it is not a promise about ground they have never seen. Anyone quoting twenty-three percent as an expectation is selling something. What these engines are worth going forward is a question with dates attached — the verdicts are pre-registered, and we will reach that calendar before we close.
So the honest reading is not the absolute level. It is the shape. All three engines compound above the index across very different decades — a credit crisis, a long bull market, a pandemic, an inflation shock. That consistency is the evidence worth keeping. But one long line can flatter. Next, we cut the track into windows and ask whether the story holds piece by piece.
Stability across windows
The track we just watched compresses everything into one line and one headline number. This slide breaks that number apart. The table shows compound annual growth rate — CAGR, the steady yearly rate that would compound to the same end result — measured over five windows: one year, three years, five years, ten years, and the full sample. Every figure is net of costs, and every figure is in-sample — the models were fit on this same history — so treat them as descriptions, not promises; the honest out-of-sample verdicts are pre-registered and still ahead.
Read across the Model3 row, the engine built on LSTM networks with attention over ETFs. Ten point zero percent over the last year. Twenty-two point two over three years. Sixteen point nine over five. Twenty-seven point eight over ten. Twenty-three point five over the full sample. Same engine, same rules, five different answers. Global shows a similar profile. The Permanent portfolio sits lower on every window but steadier — that is its job. And SPY, the S&P 500 tracker we use as our benchmark, compounds at roughly eleven percent over the full period.
Now watch the one-year column. Model3 made ten percent last year — below the market's own long-run pace. Judged on that window alone, you would call the engine broken. Judged on the ten-year window alone, twenty-seven point eight, you would call it a miracle. Both verdicts would be wrong, because both rest on a single point that moves every time the endpoint moves. The long windows tell the story; the one-year number is mostly noise.
That is the lesson this series keeps returning to: any single-window number, flattering or ugly, is a bad basis for judgment. That instability is exactly why our gate — the train, test, validate procedure — judges distributions of outcomes, not points. Next slide, we put those distributions on screen.
The distributional evidence
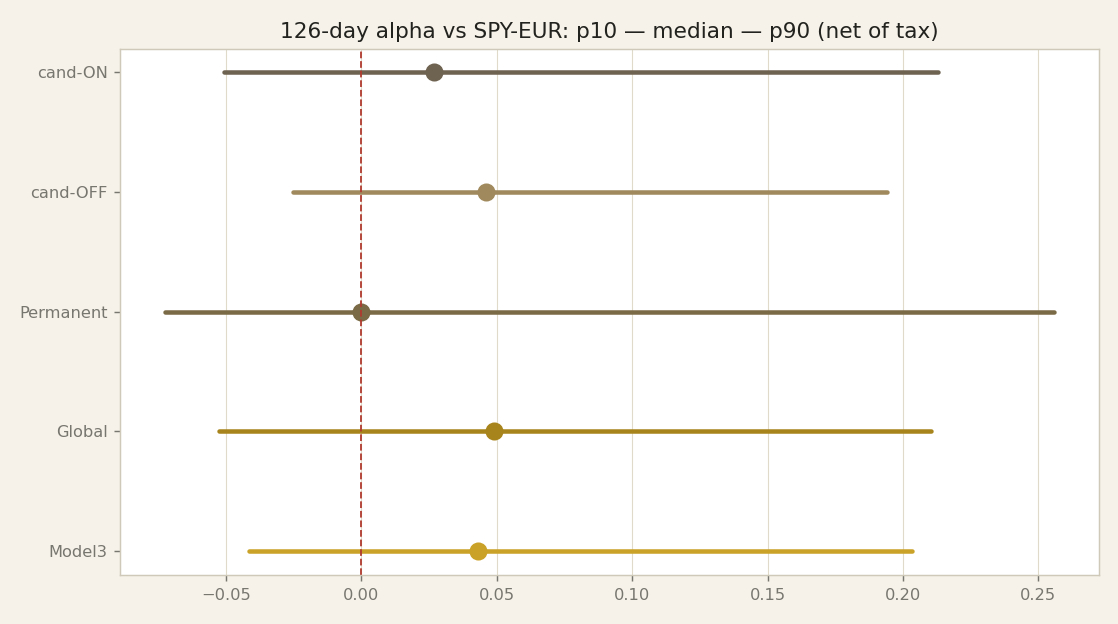
From the window table, we go one level deeper. This is the gate view, one last time — the evidence format we trust most. For each engine, the chart shows the distribution of six-month alpha. Define it carefully: take every entry day in the history — not one chosen start date, every single day. From each day, hold the engine for six months and measure its return minus the index return over those same six months. That difference is the excess return — the alpha. Repeat for all entry days, and each engine becomes a distribution, which the chart compresses into three numbers.
The dot is the median. Line up all the six-month outcomes and take the middle one. It is positive for every engine on this slide. Half of all entry days did better than the dot, half did worse; the typical experience beat the index.
The left end of each bar is the tenth percentile. One entry day in ten did worse than that. Read it as the risk you sign up for: join on an unlucky day, and this is roughly how the first six months can look. The right end is the ninetieth percentile — the lucky tail, and we refuse to advertise the lucky tail as the headline.
Why this format? Because a single backtest endpoint is one draw. Choose a kind start date, and almost any curve flatters. Asking the question from all entry points at once removes that luck.
The standing caveat: these distributions are in-sample. The models were fitted on this same history, so even distribution-wide evidence carries the asterisk. The out-of-sample verdicts are pre-registered and dated, and we will walk that calendar in a few slides.
And notice the bars do not all look alike. Those differences in shape are not noise — they are personalities. That is the next slide.
Complementary personalities
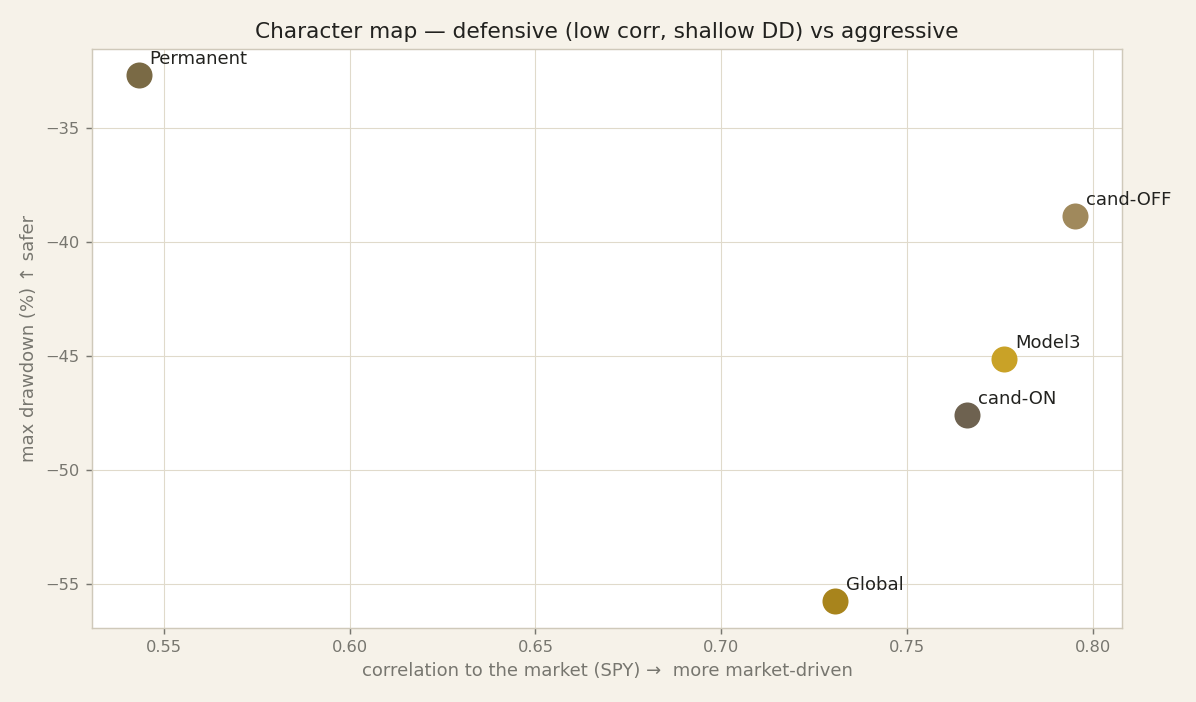
The distributions told us the edges are real but modest. This map answers a different question: are our four engines the same bet repeated, or four different characters? Quick recall from the regimes episode, compressed into one chart.
Start with Permanent. Its job is defence. It moves with the equity market at a correlation of 0.54 — correlation measures how closely two return streams move together, where 1.0 means lockstep. So Permanent lives partly in its own weather. In the global financial crisis it lost 32.7 percent while the S&P 500 lost 60.6 percent. Painful, but survivable. That is what defence means here.
Global is the opposite character. It attacks. It also digs the deepest hole of the four: a maximum drawdown — the peak-to-trough loss — of 55.7 percent. Held alone, it asked you to sit through losing more than half your capital. It earns its keep in long trends and pays the bill in crashes.
Model3 — the LSTM networks with attention over ETFs — is the generalist: rarely the best, rarely the worst, adequate across most regimes.
And cand-OFF, one of the two candidates facing the December 2026 decision, is the best risk-adjusted engine on this history: a Calmar ratio of 0.61, meaning annual return divided by worst drawdown, and a Sharpe ratio of 1.09, return per unit of volatility.
The standing caveat applies to every number here: these are in-sample figures, measured on the same history the strategies were built and tuned on. The dated, out-of-sample verdicts are still ahead.
But the shape of the map holds either way: the engines fail in different places. Different failures are the raw material of diversification — and harvesting them is exactly what the meta-blend on the next slide attempts.
The meta-blend, honestly
After slide seven, the obvious question: if the engines have complementary personalities, why not own all of them at once? We tested exactly that. A meta-blend — one portfolio that splits capital equally across the main research engines and rebalances monthly. Full history, 2007 to mid-2026, about nineteen years, net of costs and taxes. And we judged it with a pre-registered kill-gate: to count as a win, the blend had to beat every single engine on two measures at once — Calmar, meaning return divided by worst drawdown, and the tail, the tenth-percentile alpha over rolling windows against a broad US equity benchmark. One caveat before any number, the same one as always: these are in-sample figures — the engines were fit on this history — so they show shape, not proof.
Here is what came out. Return: the blend compounds at 22.5 percent, against 23.5 for the best single engine. Diversification gave back about one point. The tail: this is where it worked. The blend's tenth-percentile alpha is minus 3.1 percent, better than every single engine — they sit between minus 4.1 and minus 7.3. Drawdown: the deepest engine lost almost 56 percent at its worst; the blend about 42, and 41 with inverse-volatility weights. But the most defensive single engine only drew down 33 — so on Calmar the blend does not beat everyone. The gate's verdict, exactly as logged: partial.
So we report it as it is. The blend is defensive: it buys a smoother ride and a meaningfully better worst decile; it does not add alpha. That is worth real money to an investor who cares about the worst month. It is not a free lunch. And like everything today, its expected value out of sample stays unknown until the pre-registered dates we reach in a few slides. Next: the year-by-year view.
Year by year
From the blend, we zoom into the calendar, because averages hide what it felt like to hold these engines year by year. This heatmap shows every engine against every calendar year — one row per engine, one column per year; green where the year finished positive, red where it did not.
Start with the cell that matters most: 2008. The Permanent engine — our all-weather mix of equities, bonds, gold and cash — finished that year up 9 percent, while the S&P 500, the broad US stock index, lost 39 percent. That one cell is the whole argument for diversification by asset class: when equities collapsed, bonds and gold carried the year.
Then the 2010s. Nothing heroic happens there — the engines simply compound with the bull market. Worth saying plainly: in a decade-long equity rally, most of the return belongs to the market, not to the model. 2020 and 2023 show up as big years on the map. And 2022 — the year stocks and bonds fell together — is red for us too, just less red than the market.
Now the honest part, the reason this chart exists. Look at the red cells. Every engine has them. No row is all green. No engine wins every year — not the momentum engines, not the LSTM networks with attention over ETFs, not the blend. This heatmap kills the fantasy of 'always wins' better than any disclaimer paragraph could.
One caveat before the green seduces anyone: these are in-sample years. The models were fit on this very history, and even the simple engines were kept because they worked on it. The map describes the past; it does not promise the future. The honest out-of-sample verdicts are pre-registered and dated: December 2026 for the two candidates, 30 June 2027 for the European ensemble.
Which brings us to those two candidates.
The two candidates — decision Dec 2026
The record you have just seen, year by year, is the past — and an in-sample past at that, measured on history the main research models were fitted to. This slide is about the future, and the future is where honesty gets easier, because the future cannot be overfitted.
We have two candidates waiting outside research: cand-OFF and cand-ON. Cand-OFF is feed-independent — built to run without the external macro data feed, so if that feed ever breaks or changes, the engine does not care. Cand-ON is the opposite bet: it deliberately leans on macro curve information, on the idea that the shape of rates carries a signal that prices alone do not.
Both have been registered in testing since June 2026. Registered means what it sounds like: before the new data arrived, we wrote down the rule that decides their fate. Every month, they are judged on one criterion — clean out-of-sample, net-of-tax dominance over the incumbent, the engine currently among the main models. Clean out-of-sample means data neither model has ever seen, produced after registration. Net of tax means after every cost that real money actually pays. Dominance means better — not similar, not promising.
Why are they not among the main models already? Because both are fragile. They were trained on few seeds — few random starting points — and across seeds the results disperse: retrain with a different start, and you get a noticeably different engine. That dispersion is exactly why they wait outside.
The pre-registered decision lands in December 2026, after roughly one hundred and eighty days of clean data. Until then, their expected value is unknown, and we will not pretend otherwise. The commitment is unconditional: whatever the monitoring says, we do — promotion or rejection. The rule was written before the data, so the result cannot be argued with.
One verdict remains, on a longer clock: the European option. That comes next.
The European option — verdict 30 June 2027
One engine remains, and it is the newest — which is exactly why it gets the strictest treatment. At asset-class level: a deep-learning rotation — LSTM networks with attention over ETFs — across European sector funds, with a short-duration government-bond leg for defense. We judge it as an ensemble of three independently trained seeds — three runs of the same design — so no single lucky run can flatter the result.
On the backtest, it clears every bar we set. Roughly plus 23.9 percent net compound annual growth after the full net-of-tax gate — costs, spreads, and taxes deducted — with a maximum drawdown, the worst peak-to-trough loss, of minus 28.8 percent. And it clears the double hurdle, meaning it must beat both comparators: the European index, at roughly plus 9.6 percent with a minus 35.7 percent drawdown, and a mechanical 60/40 portfolio, at about plus 7.3 percent with minus 31.0 percent. Higher return, shallower loss, against both. But let us say it plainly: these are backtest numbers, computed on history the design process already saw. They are a ceiling, not a promise.
And here there is a specific reason for extra caution. One design lever in this engine was chosen after we watched an earlier configuration fail. That is a mild form of peeking, and pretending otherwise would poison everything this series stands for. So we froze the entire design — code, universe, rules — and pre-registered a one-shot out-of-sample verdict: a single evaluation on data the frozen design has never seen, dated 30 June 2027. One test, one date, pass or fail, no re-runs. Until then, this is a candidate, not a product.
Why persist with it at all? Geography. Everything else in the book runs on US-underlying assets. A European engine, if it survives its dated test, diversifies where the rest cannot.
So what is the surviving book honestly worth? Next, we put numbers on that.
What is it honestly worth?
That completes the tour: every engine, every pending verdict. So now the uncomfortable question we owe you: what is this toolkit honestly worth, and to whom? The table answers by audience, and every row carries its own caveat, because value without a caveat is just marketing.
First row: a retail investor in euros. The toolkit offers discipline, not magic. The objective function we optimise already includes the 26 percent Italian capital-gains tax, so every switch the engines propose must earn its keep after tax. That is a real, structural advantage over strategies that ignore taxes and look better on paper than in your account. And historically the engines defended crises better than the index. The caveat, as always: those results are in-sample — measured on the same history the models were fitted on — evidence of design, not proof of future protection.
Second row: a high-net-worth investor or family office. The offer is complementary engines — we showed how differently they behave — plus something rarer: dated out-of-sample verdicts and full disclosure of what failed. The caveat is capacity and track length: the live record is short, and we have not tested how much capital these signals can absorb before they degrade.
Third row: a fund. The value is decorrelated signal DNA — signals that move differently from mainstream exposures: sector rotation plus defensive switching, with a euro-native option. Raw material, not a finished product. The caveat: the live track is young.
Notice what all three rows share. The verified value today is the method: pre-registration, tax-aware objectives, honest accounting. The models' value is not verified yet. It gets verified on two dates — December 2026 for the two candidates, 30 June 2027 for the European ensemble. Until then, the honest price tag on the models reads "unknown". Next, we put that whole calendar on a single table.
The pre-registered calendar
If the honest answer to "what is it worth?" is "we will know on specific dates" — and that was the last slide — then those dates deserve a table of their own. You have met each of them separately; here they are in one place. This is our pre-registered calendar. Pre-registered means the rules were written down before the outcomes exist, so we cannot move the goalposts afterwards.
First row: December 2026. We promote or reject the two candidates. The rule was fixed in June 2026 and has not moved since: each candidate must show monthly clean out-of-sample net dominance. Clean out-of-sample means months the models never saw when they were built. Net means after costs. Dominance means beating the incumbent it would replace, not merely looking respectable.
Second row: 30 June 2027. Pass or kill for the European ensemble. The harness — the evaluation code — is frozen, and it will be read once. Four gates, all required. Net alpha above zero. Net Sharpe-delta above zero — it must improve risk-adjusted return, not just return. Drawdown no worse than the index. Net CAGR above both the index and a plain 60/40 portfolio. Fail one gate and it does not go live. One reading, one verdict, no quiet re-runs.
Between those dates, two standing habits. Weekly: timestamped allocations, recorded before the market moves, so the track record cannot be backfilled. We will not tell you what they are — that they exist on the record is the point. Monthly: a monitoring report against the same frozen yardsticks.
Why does this table matter so much? Because until these dates arrive, every performance figure in this series carries the in-sample caveat; the calendar is how those caveats expire. "Judge us on these dates" has been the thesis of all eight episodes — this table is that thesis made operational. Next: what we would do with new capital, as a framework, deliberately not as advice.
With new capital (framework, not advice)
The calendar is set. So let us turn to the practical question: if new capital arrived tomorrow, what would we do with it? First, what this is not. It is not personalised advice. We do not know your taxes, your horizon, or the losses you can genuinely sit through. What we can share is a framework — the process, not a portfolio. And our standing rule holds: we never state today's allocation.
Rule one: the core belongs to what is tracked and monitored in our research — the research trio — not to whatever backtest looks best. And the core is sized by a single question: what drawdown — what peak-to-trough loss — can you truly hold, through months of underperformance, without abandoning the plan? That is why the defensive anchor is Permanent-style: an all-weather mix of asset classes built to lose slowly. One caveat, as always: the trio's track record is in-sample; the models were fit on that history. So we size for the drawdown we can survive, not for the return the backtest promises.
Rule two: candidates get capital only after their dated verdicts. The two candidates report in December 2026. The European ensemble reports on 30 June 2027. Until those dates their expected value is unknown, and unknown things get paper trading, not money.
Rule three: anything that fails its date gets killed. No renegotiation, no "one more quarter". A deadline you can extend is not a deadline; it is a hope.
Rule four: implementation is decided net of tax and net of turnover — after taxes, and after the costs of all the trading a strategy demands. A strategy that wins gross and loses after costs has not won.
That is the framework. The allocation itself depends on the person holding it. What the framework cannot hide is its limits — and the full, honest list of those is next.
Honest limits — the full list
Before we close, we owe you every limitation in one place. We have named each of these somewhere across eight episodes; scattered honesty is easy to forget. So here is the full list.
First, the in-sample problem. Every number we have quoted for the research trio comes from the same history the models were fitted on. In-sample means the models saw that data during training, so the results flatter them. Every trio figure deserves that discount.
Second, sample size. Our evaluation blocks give us roughly eight to ten independent observations each. That is thin. With so few observations, luck and skill are hard to separate, and our confidence intervals stay wide.
Third, survivorship. Some of our data reflects only the funds and indices that survived to today. The failures are missing, which quietly inflates historical results.
Fourth, regime dependence. One regime — Reflation — dominates our sample. A strategy that looks strong may simply be a strategy that likes Reflation. If the coming years are built from different regimes, these numbers travel poorly.
Fifth, capacity. Sector ETFs can only absorb so much. At small size these strategies trade cleanly; at larger size, our own trading would move prices against us.
Sixth, key-person risk. This research rests on one researcher. That is a single point of failure — in judgment, in maintenance, in continuity.
Seventh, the future can differ structurally. No backtest, however careful, obliges markets to repeat their past.
And eighth, the hardest one. Our two pre-registered out-of-sample verdicts — December 2026 for the two candidates, 30 June 2027 for the European ensemble — may kill what looks best today. That is not a flaw in the process. That is the process.
If December 2026 or June 2027 says no, you will hear it from us first. That is the deal. One slide remains: why this honesty is the edge.
The edge is the honesty
Let us close the arc where it started — with the method.
We opened this series with a promise: no number shown without saying where it came from, no model trusted on its own word. Everything since has been a way to keep that promise. One method — the gate, the fixed train, test and validation sequence every engine had to pass in the same order. Behind that gate, three families of engines: momentum rules, regime filters, and deep learning — LSTM networks with attention over ETFs. Seven engines killed along the way, each with the reason written down. And a handful of survivors — not winners, survivors — each carrying a dated verdict instead of a promise.
Here is the thesis, said plainly. The thing we actually built is not any single model. Models age, markets change; today's survivor can be killed next year. The thing we built is a process that cannot lie to itself for long. Every claim is either in-sample — measured on history the models saw — and labelled as such, or out-of-sample and dated. Every decision has a date on which reality gets to vote: December 2026 for the two candidates, the thirtieth of June 2027 for the European ensemble. That is the edge. Not a secret signal, not a clever architecture — a process that makes self-deception expensive and short-lived.
This episode asked what survived, and what it is worth. What survived, you have seen. What it is worth, we have refused to guess: the honest expected value stays unknown until those dates arrive.
Thank you for following the whole arc — all eight episodes. The calendar is public, the numbers are net of costs, and the next update is not "coming soon" — it has a date on it. When that date comes, we will report what happened, whatever the result says. The edge is the honesty.