The alpha graveyard
Welcome back to AlphaFrame. Today's episode is unlike anything we have published so far, because today we are not showing you what works. We are showing you what we refused to ship.
Here is the honest headline: over the life of this project, we have killed more strategies than we have ever deployed. Killed, in our vocabulary, means something specific. The idea was built, tested with the same machinery as research, judged on the same pass-or-fail gates, and it failed, with numbers attached. Not abandoned out of boredom. Killed on evidence.
This episode is the graveyard tour: seven ideas that looked promising — some of them, frankly, brilliant — and, for each one, the exact numbers that killed it.
One definition, because the title deserves it. Alpha is the extra return a strategy earns beyond what a simple, cheap benchmark would have given you. The graveyard is where we bury strategies that promised alpha and, under our conditions, could not deliver it.
Why show the corpses? Because you cannot judge a research process by its wins — anyone can show you wins. You judge it by what it kills. A research process that never kills anything is not a process, it is a marketing department.
One caveat runs through the whole episode: every verdict here is context-specific. Our ETF universe, our transaction costs, our Italian 26 percent capital-gains tax, our retail constraints — long-only, meaning we can buy but never bet on declines. An idea that died here might work elsewhere; some kills may be false negatives, and we will say so where it matters.
We are not ashamed of this graveyard. We are proud of it. Every headstone is a decision made on numbers instead of hope. The graveyard is the method working.
Before we open the gate, let's recall what survived: the engines actually running the portfolio today. That is next.
The engines at a glance
Before we open the first grave, let's put the survivors on the table. This is the recap that opens every episode of this series — but today it plays a new role: it is the cast that made it out alive.
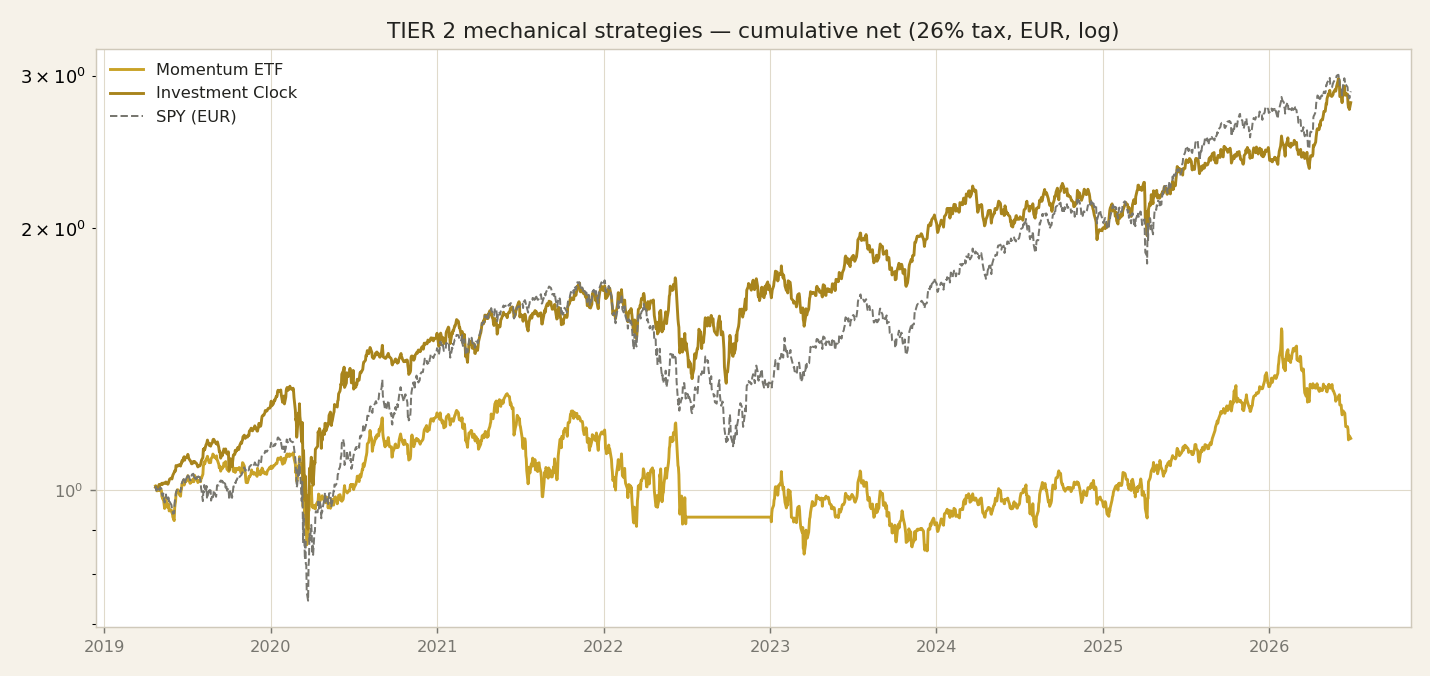
We run three families of engines. Family one: the main deep-learning research models — "research" means finished and current, not experiments. These are LSTM networks with attention over ETFs — neural networks with memory that learn to spread capital across baskets of ETFs — and that is all the detail we ever give. Three engines, three deliberate characters: a balanced all-rounder on US sectors plus gold and long Treasuries, an aggressive global engine, and a defensive, decorrelated one. Family two: the candidates — newer deep-learning ensembles, promising but on probation, judged at a fixed date rather than trusted early. Family three: the mechanical rules — no learning, just instructions we can read line by line: a bond momentum sleeve, and an Investment Clock that turns growth and inflation into regimes.
"Survived" has a precise meaning here. It means a family still holds its place after the gate we built in Episode Two: verdicts on train, test, and validation blocks separately, net of real trading costs and of the Italian twenty-six percent capital-gains tax, against the double hurdle. But note the wording carefully: the families survived. Not every member did.
Today belongs to the members that did not. Seven strategies we designed, tested, and killed: a deep-learning stock-picker, a deep-learning bond model, a euro-native bond sleeve, a regime detector whose signal genuinely worked, a momentum ETF rotation, a quality tilt, and a stock-agnostic allocator. Every kill happened in our context — our universe, our costs, our tax, our long-only retail constraints — so the same idea might still live elsewhere. And every corpse taught us something we still use. But first, a fair question deserves an answer: why publish failures at all?
Why we publish failures
Before we open the first grave, let's answer the obvious question: why would anyone publish their own failures?
Three reasons.
First, because failure is the statistically normal outcome. In the backtesting episode we cited McLean and Pontiff, who tracked published market anomalies — patterns claimed to predict returns. Out-of-sample — that is, on data beyond the period where each anomaly was found — performance dropped by 26 percent. After publication, by 58 percent. Even ideas solid enough to pass peer review lose most of their edge outside the data they were born in. So if most professionally vetted ideas decay, most of our ideas should die in testing too. A high kill rate is not incompetence; it is evidence of honest testing. A research process where everything survives is not testing anything.
Second, credibility. Anyone can show winners; showing only what worked is the cheapest trick in finance. A graveyard is different: you cannot fake it backwards. Publishing our kills, with dates and verdicts, is the strongest proof we can offer that the survivors earned their place.
Third, and most practical: each kill hardened the gate. Every rule we test with today — the train, test and validation split, the cost model, the tax haircut — is scar tissue from one of these failures. The graveyard is not a list of losses; it is the changelog of our discipline.
One caveat, and we will repeat it throughout the episode: every verdict is specific to our context — our ETF universe, our trading costs, Italy's 26 percent capital gains tax, and a long-only retail setup, meaning we can only own assets, never bet against them. An idea we killed might genuinely work elsewhere. Some of these graves may hold false negatives, and we will flag where we suspect it.
With that on the table, let's open the first grave: the deep learning stock-picker.
Kill #1: the DL stock-picker
So let's walk into the graveyard. Kill number one: the deep-learning stock-picker.
This was the most seductive project we've ever killed. We took the same deep-learning machinery that runs our ETF work — LSTM networks with attention — and pointed it at individual stocks. The pitch writes itself: if the model can read patterns across ETFs, surely it can pick winning stocks.
Here is what full testing showed. First, the model's picks were statistically indistinguishable from a plain momentum rule — and momentum here just means buying what has recently gone up. Statistically indistinguishable means the gap between the two was small enough that chance alone could explain it. All that machinery, and it converged to a strategy you could write on a napkin.
Second — and this is what killed it — neither the model nor the momentum rule beat the S&P 500 on our net-of-tax gate: the test where a strategy must outperform the benchmark after Italian capital gains tax and trading costs, across our train, test and validation windows. When a napkin rule and a neural network both lose to the index you could simply buy, the verdict is easy. Dead.
The lesson outlived the model. On price data alone, extra complexity collapses back to momentum. The binding constraint was never the architecture; it was the signal. A systematic literature survey later confirmed this is a robust finding, not our private limitation: most credible new edges come from a new data channel, not from a fancier model on the same prices.
One honest caveat, and it hangs over every gravestone in this episode: the verdict is specific to our universe, our 26 percent Italian tax, our costs, and our long-only retail constraints — we never short. Elsewhere, the idea might live; we may have false negatives. In our world, it's buried.
Next, we tried the same machinery on bonds. That one died differently.
Kill #2: the DL bond model
Kill number two, and this one stung more than the first: our deep-learning bond model. Bonds felt like natural territory for machine learning — slower-moving, driven mostly by interest rates, less noisy than single stocks. So we built an allocator on LSTM networks with attention over ETFs, and gave it the fairest fight we could.
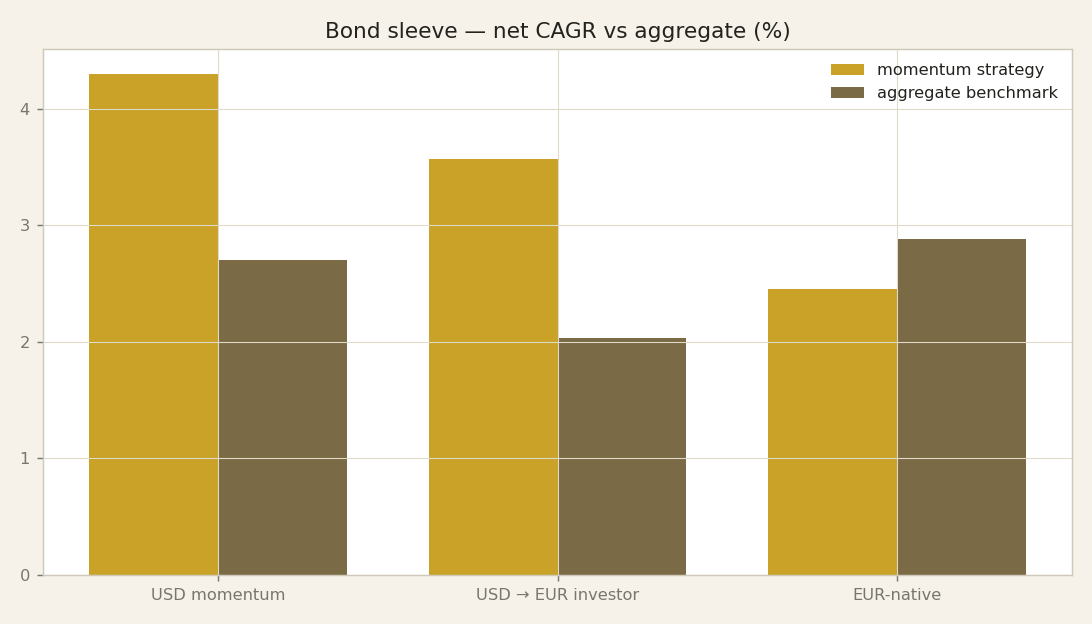
The chart shows that fight in CAGR bars — compound annual growth rate, the smoothed yearly return over the full test window. The challenger is a mechanical rule that fits in five lines of code: rank the bond ETFs by twelve-minus-one-month momentum — the past year's return, skipping the most recent month — hold the top three, equal weight. That's the whole strategy. Anyone could write it in an afternoon.
And the five-line rule won. The deep-learning model lost by roughly 1.4 to 2.6 percentage points per year, depending on the window. Risk told the same story. Our distributional gate — the test that checks a strategy's edge across many resampled histories, not one lucky path — read a median alpha of about minus 0.031. In plain terms: in the typical rerun, the model subtracted value. And its maximum drawdown — the deepest peak-to-trough loss — ran near 33 percent, against 18 percent for the simple rule. More complexity, less return, almost twice the pain.
Verdict: the five-line rule is deployable; the deep-learning model is dead. As always, dead here — in our universe, with our costs, our long-only retail constraints, and Italy's 26 percent tax. Somewhere else it might live; we accept that some kills are false negatives.
That lesson is the reason our free-rule hurdle exists at all: we demand every model beat a rule anyone could copy for free, precisely because sometimes the free rule wins. It just did. The next kill stays in the bond sleeve — but the culprit isn't a model. It's a currency.
Kill #3: the EUR-native bond sleeve
Kill number three follows directly from the last one. When the simple mechanical bond rule beat our LSTM networks with attention over ETFs, we didn't just deploy it — we tried to refine it. The obvious next step was currency. Our bond sleeve — the fixed-income slice of the portfolio — holds dollar-denominated ETFs, so a euro investor like us carries exchange-rate risk on top of bond risk. So we rebuilt the same winning rule on a euro-native bond universe: same mechanics, no currency exposure. On paper, the cleaner design.
It failed the gate — the same train, test, validation hurdle every candidate faces.
Here's why, and it may be the most instructive kill in the episode. The rule is cross-sectional momentum: it ranks the bond ETFs in the universe against each other by recent performance and holds the leaders. A ranking only carries information if the assets actually behave differently from one another — what practitioners call dispersion. And the euro bond universe turned out to be too homogeneous: the ETFs move together, so the ranking is mostly noise. There was nothing meaningful to rank. By removing the currency risk, we had removed much of the very dispersion the signal feeds on.
Meanwhile the USD version, with its currency risk, stayed deployable. Measured in euro, it still beat its benchmark by about plus 3.6 percent. The messier design won; the cleaner-looking one was the weaker one.
The usual caveat applies: this verdict is specific to our universe, our costs, our long-only retail constraints, and Italy's 26 percent tax on gains. A broader, more varied euro bond universe might give the signal something to rank, so this could be a false negative. On our shelf, though, the lesson stands: cross-sectional strategies need dispersion between assets, and elegance is not evidence.
Next, a strategy where the signal genuinely worked — and something else killed it.
The HMM regime detector: the signal WORKED
Grave number four is the strangest stone in this graveyard. Every grave so far held a strategy that failed to earn its place. This one is different: the model actually worked.
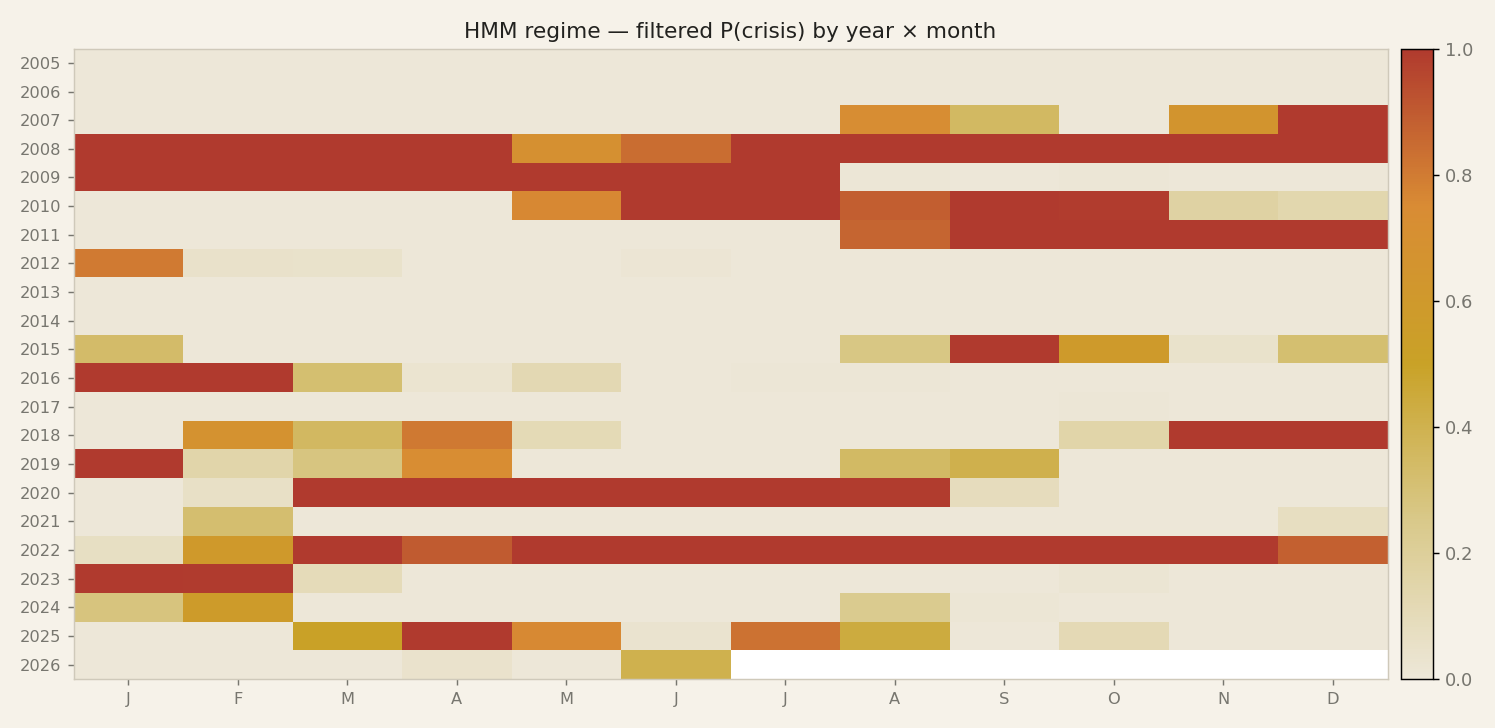
It is a hidden Markov model regime detector — the HMM, from here on. A hidden Markov model is a statistical model that assumes markets shift between states you cannot observe directly — think "calm" and "crisis" — and infers, from the data you can see, which state you are probably in. One thing matters enormously: at every step, ours used only past data. No peeking ahead, no hindsight labels. The heatmap on screen shows the regimes it inferred through time — long calm stretches, and the dark bands where it flagged stress.
Here is the twist: the signal was good. We ran it head-to-head against our simpler regime heuristic. On the 2022 fold — the out-of-sample test window covering that brutal year for both stocks and bonds — the HMM defended better at matched bull-market upside. In plain terms: we compared configurations that captured the same gains in the good times, then asked which lost less in the bad times. The HMM took about 5.8 percentage points less drawdown — drawdown being the peak-to-trough loss you actually sit through. And this was not one lucky setting. Across the risk-return frontier — the menu of settings from cautious to aggressive — we made six matched comparisons. The HMM won six out of six. A clean sweep, not a coin flip.
If we were writing an academic paper, this is where we would draft the abstract and claim success. A regime detector, tested honestly out of sample, beating its baseline at every point we measured — that gets published.
But we do not deploy papers. We deploy after-tax portfolios — in our universe, with our costs, under our constraints. What happened when this working signal met that reality is the next slide.
...and the tax killed it
So the regime signal worked. This is where most backtest write-ups stop — and where our real work began, because the next question is the one that matters: what does it cost to actually act on the signal?
Here are the mechanics. The overlay de-risks by selling down the core equity portfolio and parking the proceeds in defensive assets. But we are Italian retail investors in a plain taxable account: every sale realises capital gains, and realised gains are taxed at 26 percent. Done year after year, that becomes tax drag — return lost to taxes, not to markets.
The chart compares the two ways to de-risk: sell the core, or hedge it. Start with selling. On a global-equity book, the sell-the-core overlay costs about 2.96 percentage points per year of tax drag alone; on a US large-cap book — think S&P 500 — about 2.14. Set that against the protection the signal buys, and the net benefit turns negative. The signal was real. The implementation destroyed it.
So we tested the tax-aware alternative: instead of selling, hedge with derivatives. Under Italian rules, derivative gains and losses are 'redditi diversi' — miscellaneous income — so hedge losses offset gains in that bucket. That recovers the tax. What it cannot recover is the opportunity cost: our core engine compounds at roughly 23 percent a year, and every de-risked stretch gives up part of that.
Verdict: not deployed on our high-return books. The lesson on this gravestone: an edge you cannot implement tax-efficiently is not an edge — for us. Mind the qualifier. On a lower-return, low-turnover book, the same overlay could still earn its keep; this kill may be a false negative outside our context.
Next, a kill with a completely different cause of death: momentum ETF rotation.
Kill #5: momentum ETF rotation
From a signal that worked until the tax ate it, we move to the most famous resident of our graveyard. Kill number five: momentum ETF rotation. Cross-sectional momentum is the classic anomaly of the academic literature. Cross-sectional means we compare assets against each other, not against their own history: rank the universe by recent returns, hold the recent winners, rotate as the ranking changes. We ran it across our ETF clusters, long-only, with our real costs and our Italian 26 percent capital-gains tax included.
Over the full backtest window, it looked acceptable. Net CAGR of plus 1.9 percent, maximum drawdown of minus 34.7 percent. Not glorious, but a live candidate. Then came the gate, the same discipline we apply to every engine: three separate blocks — train, test, and validation — each judged on the median six-month alpha per block, alpha meaning return above the passive benchmark. The verdict numbers on this slide: minus 0.029 on train, plus 0.020 on test, plus 0.025 on validation. Our rule is blunt: one negative block means fail. Train was negative. Read together, the three numbers tell a precise story: the strategy's whole edge lives in the recent years. What the full window called skill was, in large part, recent regime.
Verdict: killed as a standalone engine. The lesson is one of the deepest in this episode: the total window hides regime-luck — performance borrowed from whichever regime dominated the sample — and the block structure exposes it. As always, the kill is context-specific: our universe, our costs, our tax, long-only retail constraints. Momentum may work elsewhere, and we may be logging a false negative here. In our world, it did not clear the bar.
Next, its quieter cousin: the quality tilt.
Kill #6: the quality tilt
Kill number six takes us from price signals to fundamentals, and it taught us more about reading our own numbers than any other kill. The candidate was a quality tilt: leaning the portfolio toward companies with stronger balance sheets — less debt, steadier earnings, healthier cash flows. Quality is one of the oldest documented tilts in finance, so we tested it with real hope.
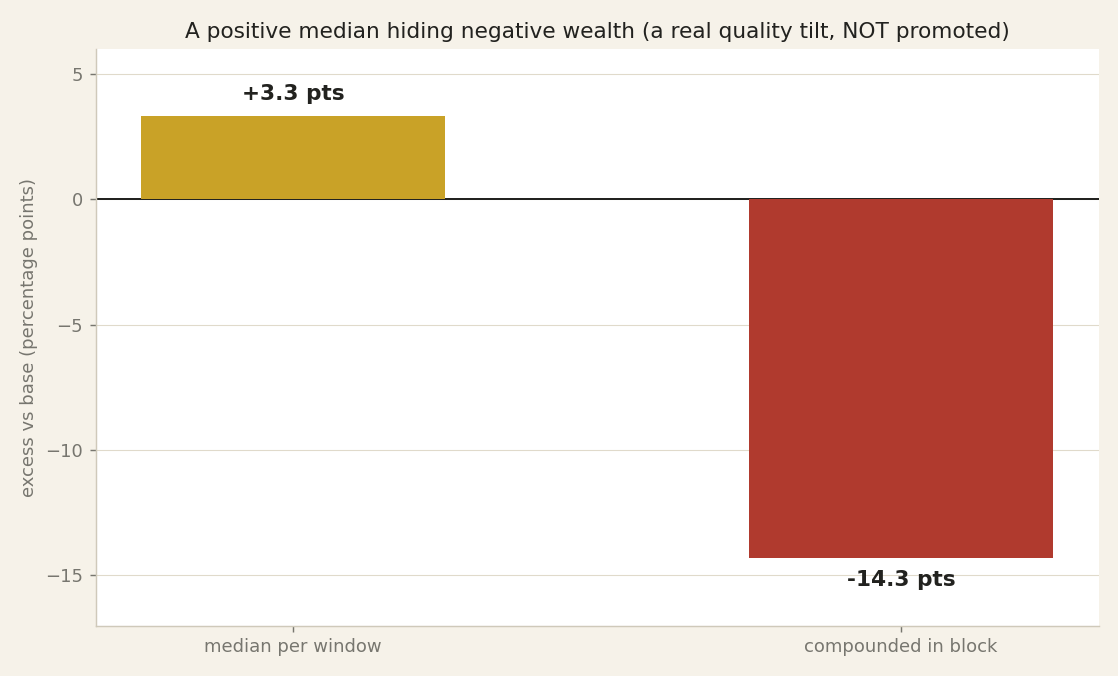
At first glance, it passed. Our gate evaluates strategies over six-month windows, and the headline metric was the median — the middle value across all those windows. The quality tilt posted a median of plus 3.3 points per six-month window in the recent block. In the typical window, it beat the base. On that number alone, we would have promoted it.
Then we looked at compounded wealth — what you actually end up with if you hold the strategy through the whole block, letting gains and losses stack on each other. Same strategy, same block: minus 14.3 points versus the base. That is the chart on this slide, and it is why this slide exists. Many small wins, and a few disasters big enough to swallow them all. The median smiled while the portfolio sank, because the median ignores how large the worst windows are — and compounding never does.
Verdict: not promoted. And this kill left a permanent mark: our gate now requires reading the median and the compounded wealth together. No strategy passes on the median alone.
The usual caveat applies. This verdict holds for our universe, our costs, our long-only retail constraints. A quality tilt built differently, somewhere else, might work; we may be recording a false negative. But we will not hold a smiling median while the money sinks.
Next, kill number seven: the allocator that tried to skip stock-picking entirely.
Kill #7: the stock-agnostic allocator
The last grave is the one that hurt the most, because it held the idea we were proudest of. Kill number seven: the stock-agnostic allocator.
We built a permutation-invariant deep-set model. In plain words: a network that sees a basket of stocks as a set — no order, no names. It was fed only rank-based features, meaning where each stock stands relative to the others, over a rotating universe, so it physically could not memorise ticker names. In principle it could allocate across any basket we handed it. That is what stock-agnostic means, and the architecture was genuinely elegant.
Testing taught us two humbling lessons in sequence. First, the model collapsed to near-equal-weight: when a network is uncertain, spreading money almost evenly is the safest answer to its loss — the score it is trained against — so that is what it learned. We fixed that and gave it room for conviction. It then became something else: a concentrated momentum proxy. All that machinery, and it had rediscovered a signal we already run, only more concentrated.
The final gate was the seat it was built for: a real satellite slot inside our research Permanent engine, the small active sleeve around our stable core. We measured the whole book — the portfolio as a whole — with it in place, net of our Italian 26% capital-gains tax and of our costs. The book did not improve. Verdict: not deployed.
We have met this lesson already in this talk; now it arrives from the other side: architecture is not signal. And price-only inputs bound what any architecture, however clever, can extract from them. As always, the verdict is local — our universe, our tax, our long-only retail constraints. With richer inputs, in a different book, the idea might live; we may be burying a false negative.
That makes seven graves. Next we lay them side by side, on a single page: the ledger.
The graveyard ledger
Here is the ledger: the whole graveyard on one slide. Seven strategies, three columns: what it looked like, the honest number, the cause of death.
The DL stock-picker, LSTM networks with attention over ETFs, looked like a sophisticated AI edge. The honest number: it matched plain momentum and never beat the S&P. Cause of death: a signal ceiling; price alone had no more to give.
The DL bond model looked like complex fixed-income AI. The honest number: minus 1.4 and minus 2.6 percentage points per year against a five-line rule. Cause of death: it lost the double hurdle; a model must beat both the benchmark and the simple rule.
The EUR-native bond sleeve looked cleaner: no currency risk. The honest result: gate FAIL, a universe too homogeneous. Cause of death: no dispersion, nothing to choose between.
The HMM regime overlay is the painful one. It looked like better crisis defence, six out of six. The honest number: minus 2.96 percentage points per year of tax drag, net negative. Cause of death: a tax-inefficient implementation under Italy's 26 percent capital-gains tax.
Momentum ETF rotation looked like plus 1.9 percent CAGR over the full window. The honest number: minus 0.029 in the train block. Cause of death: regime luck.
The quality tilt looked like a median of plus 3.3 per window. The honest number: minus 14.3 compounded inside the block. Cause of death: the median trap, where the typical window flatters while the compounded path bleeds.
The stock-agnostic allocator looked universal, one model for any basket. The honest verdict: it collapses to equal weight or plain momentum. Cause of death: the price-only ceiling, again.
One caveat we will return to: every cause of death is context-specific. Our universe, our costs, our tax, our long-only retail constraints. Killed here does not mean dead everywhere; some rows may be false negatives. Next: what this graveyard bought us.
What the graveyard bought us
So what did all those funerals actually buy us? Rules. Every corpse on the ledger you just saw became a permanent rule in our process, and this slide is the inheritance list.
The bond-model kill gave us the double hurdle. Double hurdle means a candidate must beat not just a passive benchmark but also the best free rule — the simple heuristic anyone could run for nothing. Beat the free rule, always — if a model cannot beat free, nothing else matters.
The quality-tilt kill gave us median-and-cumulative. One lucky stretch can carry an entire backtest, so a strategy must now win cumulatively over the full period and in the median block — the typical slice of time. Winning on average while losing most of the time now fails.
The HMM kill taught us tax-first design. Our Italian 26% capital gains tax now lives inside the objective — the number we actually optimize — from day one, not as an adjustment applied afterwards. We never again design a strategy gross and hope it survives net.
The momentum kill enforced per-block verdicts: we judge every test block separately, so one heroic block can no longer rescue the rest.
And the stock-picker and the stock-agnostic allocator taught us the most expensive lesson: when a deep model fails — our LSTM networks with attention over ETFs included — the fix is almost never a fancier architecture. It is new information. We now spend research budget on new data, not new architectures.
One honest caveat: these rules encode our context — our universe, our costs, our long-only retail constraints. In another context, the same ideas might deserve different rules; some of our kills may be false negatives.
Here is the punchline: the gate we run every candidate through today is the graveyard, compiled into checks. Nothing in it came from a textbook; every line was paid for. What that does to our credibility is where we go next.
The credibility inversion
There is one more thing the graveyard bought us, and it is the strangest one. We call it the credibility inversion: the graveyard — the one thing you would expect us to hide — turns out to be our strongest sales document.
Think about why. Anyone can show you winners after the fact. You test many ideas, keep the handful that happened to work, and present them as skill. That is cherry-picking, and after the fact it is essentially undetectable. But a dated, numbered list of failures cannot be faked backwards. Kill number one through kill number seven, each with a date, a test, and a verdict — you cannot retrofit that trail. Either the discipline existed when the tests were run, or the trail simply does not exist.
Professional due-diligence teams — the people whose job is to vet a strategy before money touches it — read failure disclosure as competence, not weakness. A graveyard proves three things at once: the testing was real, the bar was high, and the survivors earned their place instead of being the lucky residue of a fishing expedition.
One caveat, and we own it: our verdicts are context-specific. Each kill holds inside our universe, under the Italian 26% capital-gains tax, our costs, and our long-only retail constraints. The same idea might work elsewhere, and some of our kills may be false negatives. A credible graveyard states its jurisdiction. That is part of the honesty, not a hole in it.
So here is the practical takeaway. If you are evaluating any strategy vendor — a fund, a newsletter, a signal service — ask for their graveyard before you ask for their track record. No graveyard, no trust. Which raises the natural next question: what exactly does a kill prove, and what does it not? Let's be precise about that.
Honest limits of a kill
One more piece of honesty before we close. If publishing our failures is what earns credibility, then the same credibility demands we say what a failure does not prove.
Every verdict you have heard tonight is a verdict about an idea in our context, and only there. Our context means our specific ETF universes; our long-only retail constraints — no shorting, no leverage; the Italian 26 percent capital-gains tax that every switch must pay; our cost model; and our particular sample of history. Change any one of those, and the verdict can change too.
Take the HMM regime detector — the signal that worked until the tax bill arrived. That same overlay might genuinely suit a low-return book: a portfolio with modest expected gains, where the protection it buys costs less in realized tax. Or the quality tilt: dead in our implementation, but a different construction, in a different market, might revive it. When we say dead, we mean dead here, on our books, under our rules. We are not issuing universal death certificates.
And there is a second, harder limit: false negatives. A false negative is a good idea that fails the test through bad luck. Statistics cuts both ways. With roughly eight to ten independent observations per test block, a genuinely useful strategy can look worthless by pure chance — and we kill it anyway, because the process demands it. Some graves in this graveyard may hold strategies that were actually alive. We accept that risk knowingly. The alternative — keeping everything that might work — is how portfolios fill up with noise.
So hold both thoughts at once. The graveyard is honest, but it is not omniscient. It tells you what failed our test, in our world, on our data — nothing more. And that modest claim, as we will argue in a moment, is exactly what makes the whole method work.
The graveyard is the method working
Let's close where we began. Seven promising ideas entered this episode. Seven numbers killed them. A deep-learning stock-picker; a deep-learning bond model — LSTM networks with attention over ETFs; a euro-native bond sleeve; a regime detector whose signal genuinely worked, until our twenty-six percent Italian capital-gains tax said otherwise; a momentum ETF rotation; a quality tilt; a stock-agnostic allocator. Each arrived with a plausible story. Each left because a test we had agreed on in advance said no — in our universe, at our costs, under our long-only retail constraints.
That last clause matters one final time. These are local verdicts, not universal ones. Some of these ideas may work elsewhere, and some of our kills may be false negatives. We can live with that. What we cannot live with is a process that never kills anything — because a process that never kills is a process that never tests. If every idea you try ends up in your portfolio, you are not doing research; you are collecting stories.
So the graveyard is not the embarrassing annex of this project. It is the method working exactly as designed. Every survivor you met in earlier episodes stands on this pile of seven honest kills. Their credibility is not despite the graveyard; it is built from it.
Next episode is the last of the series, and it is the mirror of this one: what survived. We will give you the verdicts, engine by engine; what each survivor is actually for; what the whole system is honestly worth, with no rounding up. And we will show you the two dated decisions, December 2026 and June 2027, on which we have pre-registered our own judgment — written down in advance, before the results arrive — so that future-us cannot quietly move the goalposts. Thank you for walking the graveyard with us. Next time, the survivors.