The method
Let me start with a confession. Early in our work, one of our own backtests showed a return of more than ten thousand percent a year. Ten thousand. On paper, we had found the machine that prints money. We did not celebrate for long. When we re-ran the same idea on clean, tradable prices, its Sharpe ratio — that is, its return once you adjust for the risk you took to get it — came out at zero. Not small. Zero. The whole thing was an artefact: a ghost produced by the data, not by any real edge in the market.
Sit with that for a moment. A number as beautiful as ten thousand percent turned out to be worth exactly nothing. And here is the uncomfortable part: while we were looking at it, it felt completely real. The chart went up and to the right. The code ran without errors. Nothing screamed "fake."
So this is the question that drives the whole episode: if a result that gorgeous can be worthless, how do we ever trust any number we produce? How do we tell a genuine edge from an expensive illusion?
Our answer is not a smarter model. It is a harder exam. We built a gate — a fixed set of tests that every strategy must pass before we believe it, before it manages a single euro. The same exam for our deep-learning models, for our simpler mechanical rules, for everything. No exceptions, no favourites.
Over the next half hour we will walk through that gate, piece by piece: how we measure skill, where we draw the line between passing and failing, and the traps that fooled us along the way. Because in this field, the discipline is the edge. Let's begin.
The engines at a glance
Before we open the exam, let us line up the contestants, because the whole point of this episode is that they all sit the same one. We run three families of strategy. The first are our main research models: LSTM networks with attention that allocate across ETFs — deep-learning systems that learn patterns across many assets at once. The second are the candidates: newer models, or variants of the main ones, that we are still weighing and have not promoted. And the third are the mechanical strategies: simple, transparent rules, sometimes just five lines of code — a momentum rule, a regime filter — that anyone could write down and check by hand. Very different animals. The deep-learning models are opaque and expensive to train; the mechanical rules are cheap and easy to read. Our instinct, and probably yours, is to expect the complex thing to win. Hold that thought — we will test it directly later, and the answer is not what you would hope. Here is the discipline that runs through everything that follows: we do not grade these three families on different scales. We do not give the neural network the benefit of the doubt because it was hard to build, and we do not forgive the simple rule because it is elegant. From this point on, every engine — the deep model, the candidate, the five-line rule — faces the exact same gate, the same exam, judged on the same held-out data with the same pass mark. No favourites. No home-field advantage for complexity. That symmetry is what makes the comparisons honest, and it is what lets us say, plainly, when the expensive thing simply is not worth it.
Why a single number lies
So let's start with the number everyone quotes. It has a name: CAGR, the compound annual growth rate. It answers one question — over the whole period, how fast did the money grow, on average, per year? It sounds authoritative. And it hides two problems that should worry us.
The first problem is that CAGR depends on exactly two points: where you start and where you end. Everything in between is compressed into a single line drawn from the first day to the last. Move the start date by a few months — begin just before a crash instead of just after it — and the same strategy can go from impressive to mediocre, or the other way around. The verdict flips, and nothing about the strategy has changed. That should already make us uneasy. A measure of skill should not swing on where we happened to plant the flag.
The second problem is deeper. CAGR cannot tell steady skill apart from luck. Imagine a strategy that did almost nothing for eight years, then caught two extraordinary years bolted onto the end. And imagine another that added a little, quietly, every single year. They can report the same CAGR. The same headline number. But they are not the same thing at all — one is a repeatable process, the other is a lottery ticket that already paid out. CAGR answers "how much" and never answers "how reliable".
And "how reliable" is the only question that matters when you are deciding whether to trust your own money to a rule. So we need a measure that does not lean on two endpoints. We need something that looks at the whole experience — every stretch of the history, not just the first day and the last. That is what the gate is built to do, and it is where we go next.
The same track record, a dozen CAGRs
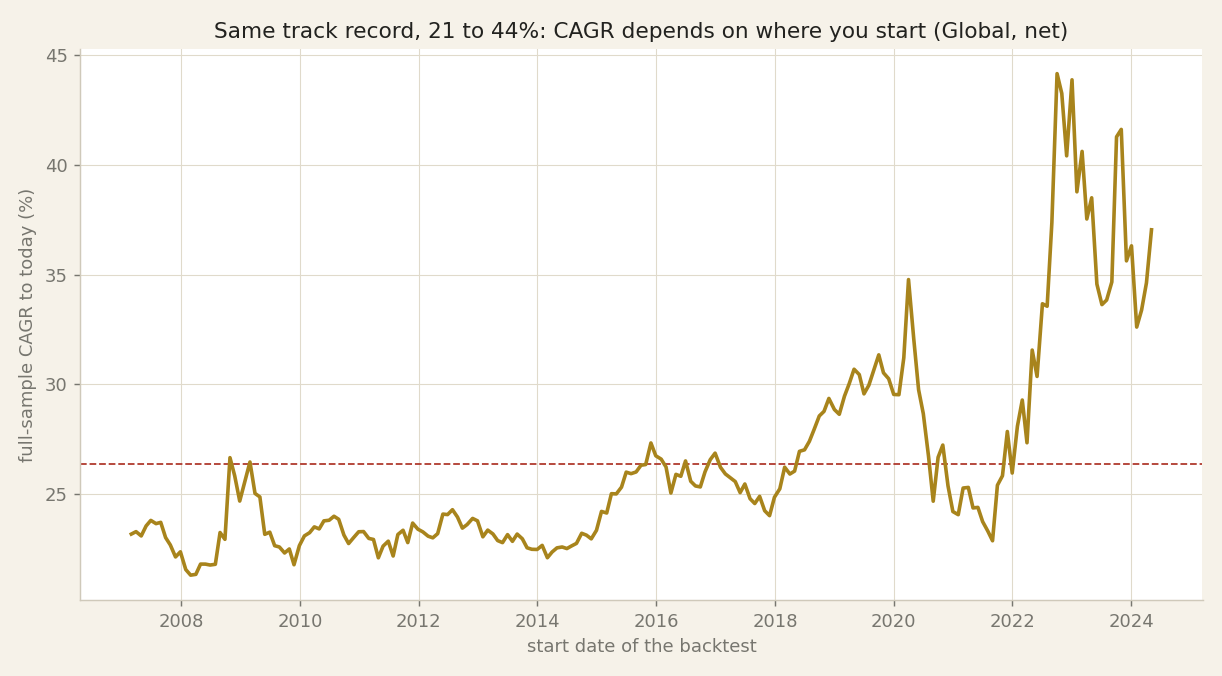
We just argued that a single number can lie: move the start date, and CAGR flips its verdict. Now let us prove it. What you are looking at is one line chart, and it uses one track record only — our aggressive Global engine, net of tax, run all the way to today. Nothing about the strategy changes across this picture. The only thing that moves is the horizontal axis: the start date of the backtest. The vertical axis is the full-sample CAGR — the compound annual growth rate you would quote if you had begun on that date. Walk along the line with me. Start near two thousand seven or two thousand eight, through the financial crisis, and the line sits around twenty-one percent. Slide the start rightward into the recent years, and it climbs to roughly forty-four percent — more than double. The average across every possible start sits near twenty-six percent. Same trades, same exits, same everything — and yet a dozen honest CAGRs, from twenty-one to forty-four. The short, recent windows flatter the number the most, because they miss the drawdowns. So when someone quotes you one CAGR, remember: you are largely hearing where they chose to begin. That is why, on the next slide, we stop trusting a point and look at the whole distribution of alpha.
The gate: the distribution of alpha
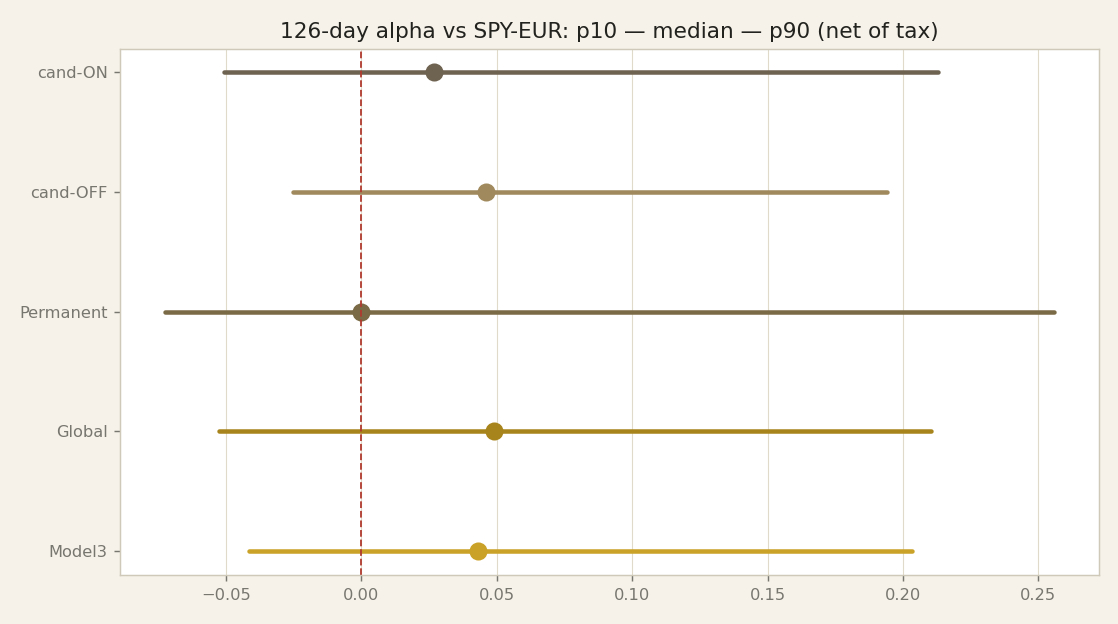
So if a single number lies, what do we look at instead? Start with the word alpha. Alpha is simply excess return over the benchmark — for equity, that benchmark is the S&P. Beating alpha means beating the index, not just making money while the whole market rises. Now here is the move that changes everything. Instead of collapsing a strategy into one final number, we ask the same question on every single day in history. Standing here, on this exact date, if we entered now and held for about six months, would we have beaten the index? One day gives one answer. But history hands us thousands of possible entry days, and each one gives its own answer. Thousands of answers is not a verdict — it is a distribution. That distribution is the gate. We do not read it as one number; we read its shape. Three landmarks tell us almost everything. The median is the typical window — the middle outcome, the result you would most plausibly have lived through. The tenth percentile is the bad tail: enter on an unlucky day and this is roughly how badly it went. That tail is our honest measure of risk. The ninetieth percentile is the good tail — the reward when timing was kind. The chart shows this whole shape, per model, side by side. And notice what this quietly forbids. It is the exact opposite of cherry-picking a flattering period. We are not choosing when to start; we are not telling a story from two lucky years. Here the periods are all of them, the good and the ugly, weighted by how often they actually occurred. A strategy cannot hide its bad entry days inside a distribution that already contains them. That is why, before we trust anything, we look at the whole experience — not the endpoints, but the honest spread of what could have happened.
Train / test / validation
So we have a distribution of outcomes for every strategy. But there is a prior question: which slice of history are we even allowed to judge it on? Here is our answer. We split the timeline into three chronological blocks. The first is the training block: this is where we build the strategy, where we are free to look, tune, and learn. The second is the test block: while we are still developing, we check our work here. The third is the validation block — held out, untouched, reserved for the final verdict.
Why bother? Because judging a strategy on the same data you built it on is like grading your own exam. Of course the answers look right; you wrote them to look right. Any rule, given enough freedom, can be bent to fit the past it was born from. So a good number on the training block tells us almost nothing. The verdict only counts on blocks the strategy never saw.
And here is the part people miss. This discipline is not just for the elaborate models. It applies to the simplest rule too — a plain momentum filter, a single threshold. Because the act of choosing that rule, after you have already looked at the data, is itself a form of fitting. You tried a few, you kept the one that worked, you quietly discarded the others. That selection leaves a fingerprint, and the fingerprint only shows up out of sample.
So from here on, every number we quote comes attached to a block. Train, test, or validation — we will always tell you which one, because the label is what makes the number honest. The most demanding label is validation: data the strategy has never touched. That is where the real exam is written, and next we will see exactly what it takes to pass.
The PASS rule
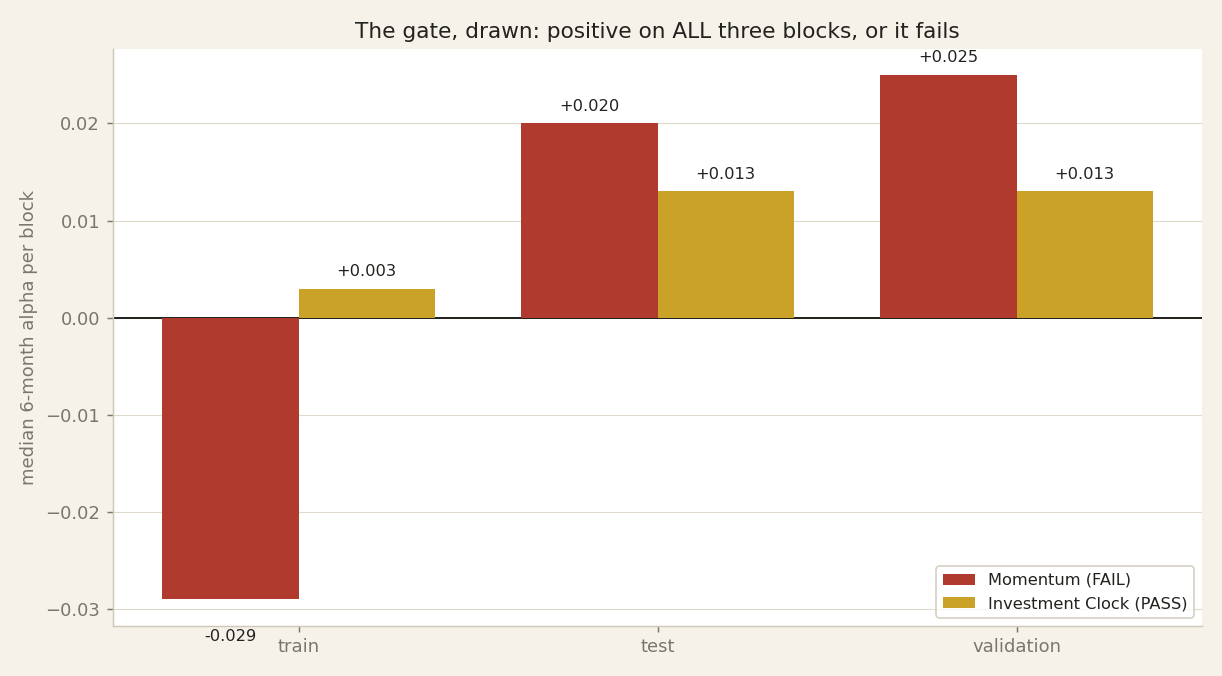
So we have the distribution, and we split history into three blocks. Now the rule itself. A strategy passes only if the median alpha is positive on train, and on test, and on validation. All three. Not two out of three. Not "close enough on the third". Three green lights, or the idea is dead. One negative block and it fails, full stop. Let me be precise about two words. Median, not mean. The mean is the average, and the average is dragged around by a few extreme windows. One spectacular six-month stretch can lift the mean of a strategy that is mediocre the rest of the time, and hand you a flattering number that describes almost none of your actual experience. The median is the middle window, the typical outcome, the one you should expect on a normal day. It cannot be bought by a single lucky spike. That is why we judge on it. And why all three blocks? Because each block is a fresh chance to be wrong. Train is where we built the idea, so passing there proves almost nothing. Test is where we watched it while developing, so it has already seen our eyes. Validation is the block the strategy never touched, and that is the one that carries real weight. Demanding a positive median on all three means the edge has to show up in data we fitted, data we peeked at, and data we locked away, all at once. Notice how much harder this is than the usual pitch. The usual pitch is "look at this nice upward curve". Our rule ignores the curve and asks the same blunt question of three separate worlds. It is unforgiving on purpose. And it is exactly why so few things survive it.
The gate, drawn
So that is the rule in words. Let us now see the rule in a picture. On screen is a grouped bar chart. Along the bottom are three groups, one for each block of history: the train block on the left, the test block in the middle, the validation block on the right. Within each group we plot two bars: the median six-month alpha, our excess return over the benchmark, for two mechanical strategies. Red is Momentum. Gold is the Investment Clock. The zero line runs across the middle, and this is the line that decides everything. Look at Momentum first. On train, the red bar hangs below zero, minus zero point zero two nine. On test it climbs to plus zero point zero two zero, and on validation to plus zero point zero two five. Two healthy green-side bars, one bar below the line. The rule says positive on all three, so Momentum fails. Now the Investment Clock, in gold: plus zero point zero zero three, plus zero point zero one three, plus zero point zero one three. Small bars, but all three sit above zero. It passes. Here is the teaching point. The two big recent Momentum bars do not rescue it. One block below the line is a failure, full stop. That is the discipline the gate enforces, and in a moment we will see why even passing this is not yet enough.
Median AND cumulative — a subtle trap
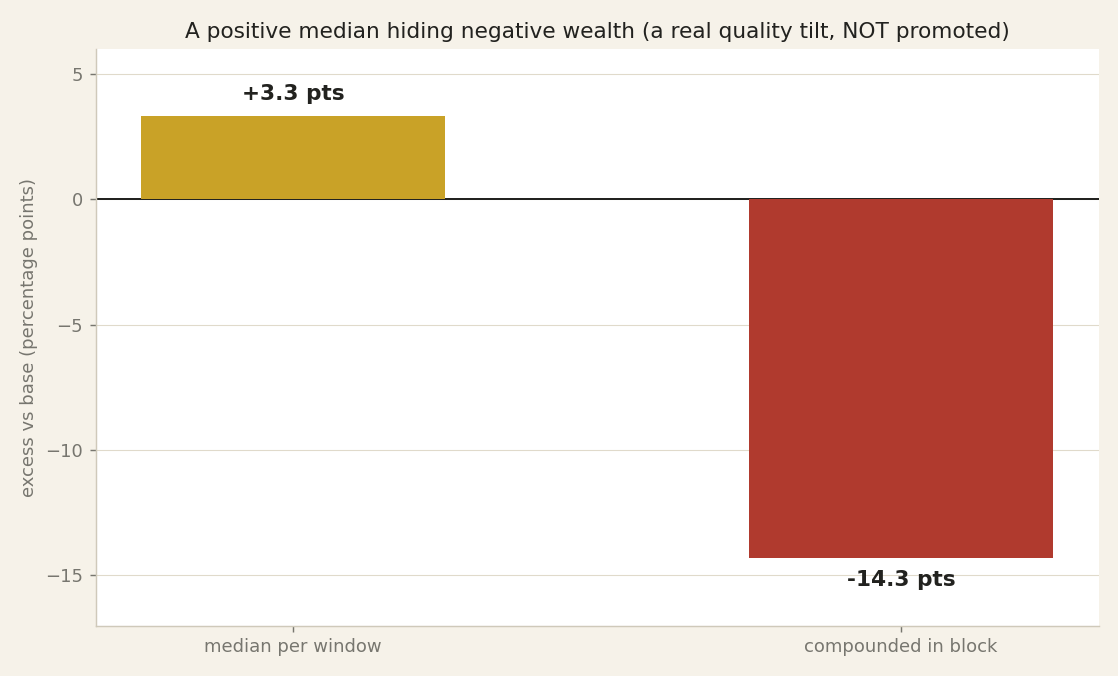
So the gate demands a positive median on all three blocks. You might think that settles it. It does not. Here is a trap that fooled us, and it is worth showing plainly. A positive median can sit right next to negative compounded wealth. The two can point in opposite directions at the same time. Let me give you the real case, from our work on fundamentals. We tested what is called a quality tilt — a rule that leans the portfolio toward companies with stronger balance sheets. On the recent block, its median alpha was plus three point three points per window. Positive. On our headline gate, it looked like a pass. But when we asked the other question — if you had simply held this tilt through the whole block, what would your money have done? — the answer was minus fourteen point three points versus the base. Positive median, deeply negative wealth. How can both be true? Because the median only tells you what the typical window looked like, and most windows were quietly positive. It says nothing about size. A handful of disastrous windows, each far larger than the small everyday gains, dragged the compounded return down and never showed up in the middle of the distribution. The median smiles while the wealth sinks. So we changed the rule. We now read the median together with the block cumulative — the actual compounded return over the same period. A strategy has to survive both. That quality tilt passed on the median and failed on the wealth, so it was not promoted. It stayed a candidate, and nothing more. One number was never going to catch this; two, read side by side, did.
When the median smiles and wealth sinks
We just said the median and the compounded return can disagree. Here is that disagreement, drawn from a real case in our fundamentals work. Two bars, one strategy: a quality tilt — a rule that leans the portfolio toward companies with stronger balance sheets — measured against the base over the recent block. The vertical axis is excess return versus the base, in percentage points; the line across the middle is zero. Look at the gold bar on the left. That is the median per window: plus three point three points. It stands above zero. Window by window, the typical six months looked like a small win. On our headline gate, this passes. Now the red bar on the right. That is the compounded return over the same block — what your money actually did if you held the tilt straight through. Minus fourteen point three points versus the base. It plunges far below zero, nearly five times the height of the gold bar in the other direction. Same strategy, same period, opposite signs. Many small positives, a few disasters large enough to swallow them all — the median smiles while the wealth sinks. This is exactly why we read both numbers, never one alone. That tilt was not promoted. Which brings us to the rule we built from it: the double hurdle.
The double hurdle
Passing the gate on its own is still not enough. Beating the passive index — just holding the S&P and doing nothing — is a low bar, and it is the wrong bar. So we add a second hurdle. A strategy must also beat the simplest free rule we can write on the same universe of ETFs. The most honest competitor is a plain momentum rule: buy what has been going up lately, hold it, and re-check every so often. Five lines of code, no training, no data to buy, nothing to fit. If our clever machinery cannot clear both hurdles — the index and that five-line rule — then the machinery has not earned its place.
Let me give you two real verdicts. First, equities. We built an LSTM network with attention that allocates across stock ETFs — the kind of model that is supposed to see patterns a human cannot. On the gate, it turned out to be indistinguishable from the plain momentum rule, and neither of them beat the S&P. Same outcome, one of them for free. So we killed it. Second, bonds. There our deep-learning model actually lost to a five-line momentum rule — the simple rule added roughly one-point-four to two-point-six points a year over the model. The complexity was not neutral; it was actively worse.
The lesson is blunt, and we apply it to ourselves before anyone else does. Complexity is not free. It costs compute, it costs maintenance, and above all it costs the risk of fooling yourself with a model too intricate to audit. So if all that complexity cannot beat five lines of code, then complexity is not an edge — it is a cost. We would rather ship the five lines.
The double hurdle, scored
We just named the double hurdle: to earn its keep, a strategy has to beat the passive index AND beat the simplest free rule. Now let's score two of our own contenders against both bars. Look at the table. Two rows, two columns of judgment: "beat the index?" and "beat the free rule?". Row one is our deep-learning stock-picker on equities — LSTM networks with attention over ETFs. Against the passive index, it lands no better than flat. Against a plain momentum rule — buy what's been rising — it is statistically indistinguishable. Same performance, within the noise. Verdict, right-hand column: dead. Row two is our deep-learning bond model. Here the number that matters is the gap: it LOST to a five-line momentum rule by roughly one-point-four to two-point-six percentage points per year. Not a rounding error — that's real money compounding the wrong way. Verdict: the simple rule wins, and the simple rule is what we would actually deploy. Read the two rows together and the lesson is blunt. Complexity is not free. If it can't clear both bars — beat the index and beat the free rule — it isn't an edge. It's a cost. Which sets up the harder question: how do we stop ourselves from cheating on these tests?
Kill-gates, pre-registered
So far we have talked about how we judge a result. Now let's talk about something we do before we ever see a result: we write down what would kill the idea. Before a single test runs, we fix the fail thresholds in advance. If the median alpha falls below this line, if the strategy loses to the simple rule, if the bad tail is worse than that — the idea is dead. We commit to those lines on paper first. This is exactly what a serious clinical trial does. Doctors register, before the trial begins, what would count as failure, so they cannot look at the data afterward and quietly redraw the finish line around wherever the drug happened to land. We do the same. Pre-registration takes away our freedom to rationalise a disappointing result into a success after the fact. And there is a second rule that matters just as much: we test one idea at a time. This sounds obvious, but it is easy to violate. If you run twenty ideas in parallel and celebrate the one that passes, you have not found an edge — you have found noise. With twenty independent tries, one clearing the bar by chance alone is roughly what you should expect. The passing result feels real; it is arithmetic. Finally, we order the exams cheapest-first. The quick, blunt checks run before the slow, expensive ones, so a bad idea dies in an afternoon instead of after two weeks of computation. That ordering is not just efficiency — it protects our judgment, because the longer we invest in an idea, the more we want it to be true. Kill it early, kill it cheap, and kill it against a line we drew before we could fall in love with the answer.
The kill-gates, pre-registered
A moment ago we said the fail criteria go on paper before the test, like a clinical trial. Here they are, one row each. Look down the left column. Row one, the distributional sign: median six-month alpha at or below zero on any of the three windows — train, test, or validation — and the idea is dead. Not the average of the three. Any one of them. Row two, beat the passive index: if the strategy does not distributionally dominate simply holding the index, it fails. Row three, beat the free rule: it must be clearly better than the simplest rule on the same set of ETFs — otherwise we are paying for nothing. Row four, net of tax and costs: we subtract a twenty-six percent tax and trading costs, and if the edge disappears after that, it is dead. Row five, one authoritative number: if it only survives as the best of many variants, that is cherry-picking, and it fails. Row six, robustness: change the random seed, the window, or the rebalancing schedule — if the result flips, it is dead. Every threshold in this table was written down before we looked at a single result. That discipline is what earns the one number we report next.
One authoritative number
So a test disappoints us. The median comes back flat, or negative on one block. And the temptation, right there, is almost physical: retry. Nudge one setting, widen a window, change how we rank the ETFs, and run it again. Surely one of those variants will pass. And here is the uncomfortable truth — one of them almost certainly will. If you try twenty slightly different versions of the same idea, pure chance hands you at least one that clears the bar. It is the exact same arithmetic as a drug trial that quietly tests twenty doses and publishes only the one that beat the placebo. That is not a discovery. That is fishing, and then framing the fish. So we hold ourselves to a simple rule. The result that counts is the one we pre-registered — the version we committed to before we saw the outcome. Not the best-looking variant we pulled out of the water afterwards. If we genuinely need to sweep a parameter — and sometimes we do, because we honestly do not know the right value in advance — then we do not get to keep the winning cell. We judge the whole sweep by the median across all the cells, never the maximum. The median of twenty tries tells you what the idea does on average; the maximum only tells you how lucky your best roll was. This feels like tying our own hands, and it is. It means we throw away numbers we would love to quote. But every number we throw away is a lie we chose not to tell. One idea, one pre-registered verdict, one authoritative number. That is the price of a result you can actually trust six months from now, when the market — not the backtest — is grading you.
Honesty about the sample
Now we owe you a hard confession about the sample itself, because it changes how much any single result is allowed to mean. Remember: for every day in history we measure the alpha over the next six months. That sounds like thousands of observations. It is not. Two windows that start one day apart share almost all of their data, they overlap on nearly six months of the same market. So the observations are not independent, and the honest count is much smaller. In each block we really have only about eight to ten truly independent windows, roughly one per non-overlapping six-month stretch. Eight to ten, not thousands. That number should make us humble. With a sample that small, a median edge under roughly five points per window, seen on a single block, is statistically indistinguishable from luck. It could be a real skill; it could just as easily be the coin landing our way a few times in a row, and we would not be able to tell them apart. This is not a technicality we can wave away, it is the core limit of the data. And it is exactly why the gate is built the way it is. We do not ask for a big number on one block. We ask for the right sign, a positive median, on three separate blocks at once, train and test and validation. Getting the sign right three times by chance is far less likely than getting it once. That is how we buy back some of the confidence the small sample takes away. It also means no gate result is ever a certainty. It is evidence, calibrated to what this data can honestly support, and no more. The best that the data can give us is a well-founded bet, never a guarantee.
Net-tax first
There is one more filter, and for a real investor it may be the harshest of all. Every number you have seen us judge tonight is judged net. Net of the Italian twenty-six percent tax on capital gains, and net of the real costs of trading — the spread you pay, the commissions, the friction of actually moving money. This matters more than people expect. A strategy that trades often, or that harvests many small gains, hands a slice of every winning window to the tax office and to the broker. That slice does not compound for you; it is simply gone. On our own models we have measured that drag directly. Moving from the gross return — the number a naive backtest prints — to the honest net return costs between three and four-point-four points a year. Sit with that figure for a moment. Three to four-point-four points a year is larger than most of the factor premia that get published in academic papers and sold as edges. In other words, the tax and cost drag alone can be bigger than the entire supposed advantage of a strategy. The chart on this slide shows exactly that gap, the height that vanishes between gross and net. So the rule is simple and unforgiving. A strategy that wins on gross returns but loses once tax and costs are subtracted is, for someone actually investing their money, a losing strategy. Full stop. And here is the quiet scandal: almost no foreign backtest prices this in. They are built for a tax-free or differently-taxed world, and their beautiful gross curves would never survive the Italian net-of-tax test. We put that test first, not last.
The artefact catalogue
We keep a catalogue. Not of our wins, but of our lies — nine backtests that once looked brilliant and turned out to be false. For each one we record two numbers: what it claimed before we caught the flaw, and what was left after. Let me walk you through a few, because the pattern is more useful than any single number.
First, a model that beat the equal-weight benchmark seven times out of eight. Impressive — until we added one more random seed. Then it was seven out of twelve. That is a coin flip. The "skill" was the seed we happened to pick.
Next, a nine-point improvement that we traced back to its source: ninety-seven percent of it came from a single bull market. Not a strategy, a calendar.
Then a variant reporting plus thirty-seven-point-nine percent. Inside, the code had silently dropped a position that fell one hundred percent — a total wipe-out, quietly deleted. The honest value was plus eight-point-nine.
A strategy showing plus one hundred seventy-nine percent evaporated the moment we counted one second-order tax cost we had missed.
And the one from our first slide: the short strategy printing more than ten thousand percent a year. On tradable prices, its risk-adjusted return — its Sharpe — was zero. It only existed because our fill prices were fictional.
Nine perfect backtests. Nine autopsies. Every one of them would have looked spectacular on a slide, and every one of them was worthless. This is why we are so slow to celebrate a good curve. The failure mode is not rare; it is the default. A backtest is guilty until proven innocent, and the catalogue is our record of exactly how a beautiful number dies.
Adversarial verification
Passing the gate is not the end. It is the moment a result goes on trial. Every important pass we get, we then hand to an independent check whose only job is to try to break it. Not to admire it — to refute it. We ask four blunt questions. First: is this just a data artefact? A quirk of one data source, one cleaning choice, one lucky segment. Second: is it statistically real given how small the sample truly is? Remember, the six-month windows overlap, so a block holds only about eight to ten independent observations — a thin base to declare victory on. Third: is there hidden look-ahead? Any place where information from the future leaked, quietly, into a decision in the past. And fourth: is the economic magnitude actually there once we count everything — the tax, the costs, the trading friction — or does the edge shrink to nothing when it meets the real world? We run these checks as an adversary, because a friendly reviewer confirms what he hopes to find. Several of our own passes did not survive this step. Some were downsized: the edge was real but smaller than the first result claimed. Others were killed outright: what looked like skill was one of the artefacts from our catalogue, wearing a better disguise. That is uncomfortable. We built those results; a part of us wants them to stand. But the whole point is to separate what we want from what is true. A result that we ourselves attacked hard, from four directions, and still could not break — that is the only kind we are willing to trust, and the only kind we will put in front of you.
What the gate gives you
So after all of this, what does the gate actually hand you? Let us be precise, because this is where honesty matters most. The gate gives you evidence. It never gives you certainty. What it does is bound one specific danger: selection bias, the risk that we fooled ourselves by picking a lucky period or a lucky variant. It does not, and cannot, bound economic risk. The world can change. A regime that held for twenty years can break next Tuesday. The future is allowed to differ from the past, and no exam, however strict, repeals that. So when a strategy passes, we do not say "this will work". We say "this survived the hardest test we know how to build, on data it never saw". That is a much smaller, much more honest claim. And here is the part that keeps us honest about ourselves. Our main research models today are still judged in-sample. They were built and tuned on history, so the gate results you have seen for them are strong, but they are not yet the real out-of-sample verdict. That verdict is still ahead of us. Two candidate models, LSTM networks with attention that allocate across ETFs, face a pre-registered decision on clean, unseen data in December 2026. Pre-registered means we have already written down what would make us keep them and what would make us kill them, before the data arrives, so we cannot move the goalposts afterward. We will report the outcome either way. That is the whole point. The discipline we have described is not something we apply only to other people's strategies. We apply it to our own, on a fixed date, in public, with the kill rule written in advance. If our own models fail their exam, you will hear it from us.
The method is the product
So let us close where we started. The number that opened this episode — a backtest showing more than ten-thousand percent a year, whose risk-adjusted return on clean data was exactly zero — was not an accident. It is what this whole field looks like when nobody holds it to account. And that tells you what we actually sell. It is not a strategy. It is a process.
Think about what the gate really is. It is an exam written before we see the results. The pass rule — a positive median on train, test, and validation, all three — is fixed in advance, so we cannot move the finish line after the race. It is judged after the Italian twenty-six percent tax and real trading costs, because a strategy that wins gross and loses net is, for a real investor, a loss. And it is honest enough to publish its own failures — nine perfect backtests, nine autopsies, kept in a catalogue we do not hide.
That last part is the one people find strange. Why show the world your mistakes? Because a method you can only trust when it flatters you is not a method — it is marketing. The value is precisely that it kills our own ideas: a deep-learning stock-picker no better than plain momentum, a bond model beaten by five lines of code. A process that survives its own honesty is the only thing worth selling.
In a field full of curves that only go up, that discipline is the edge that does not decay. Strategies fade. Regimes turn. But an exam that cannot be gamed keeps working, because it is built to distrust the very numbers we most want to believe.
Next episode, we go one level deeper into that distrust: backtesting rigour — why strong performance over the whole window, however beautiful, is not a forecast of the future.